
Out-of-home has always been good at one thing: being seen. A billboard on a highway, a screen in a bar, a display at the checkout lane. The harder question is what happens next.
Who actually saw that screen? And did they go on to buy anything?
Our new DOOH/OOH (digital out-of-home/out-of-home) norms answer that question across hundreds of recent sales effect studies. ABCS starts with the households actually exposed to an ad and connects them to purchases across categories, campaign sizes, and channels. Because exposure and outcomes come from one source, OOH gets measured on the same footing as the most sophisticated digital media. Here’s what the numbers show.
OOH delivers sales lift and brings in new buyers
Across the campaigns in our norms, DOOH/OOH delivered a +3.5% median sales lift.
Where that lift comes from is the more interesting part. 71% of incremental sales came from more households buying, not from existing buyers spending more. Household penetration rose 2.5%, while basket size moved +0.5%.
OOH has long been bought as a reach medium. But it does so much more. These numbers show it’s also a performance medium, turning people who weren’t buying the brand yesterday into new households at the register.
DOOH adds to the media mix
Many brands don’t run OOH on its own, so we also looked at multichannel campaigns. Campaigns that included OOH saw a 5.0% median sales lift, versus 4.0% for those without it. Median iROAS for campaigns with OOH came in at $1.10 for every dollar spent.
If you judge OOH only by its line in the media plan, you miss part of its contribution. Is your measurement looking where OOH’s impact actually shows up? We can help you there, if you need it!
The OOH effect looks different by aisle
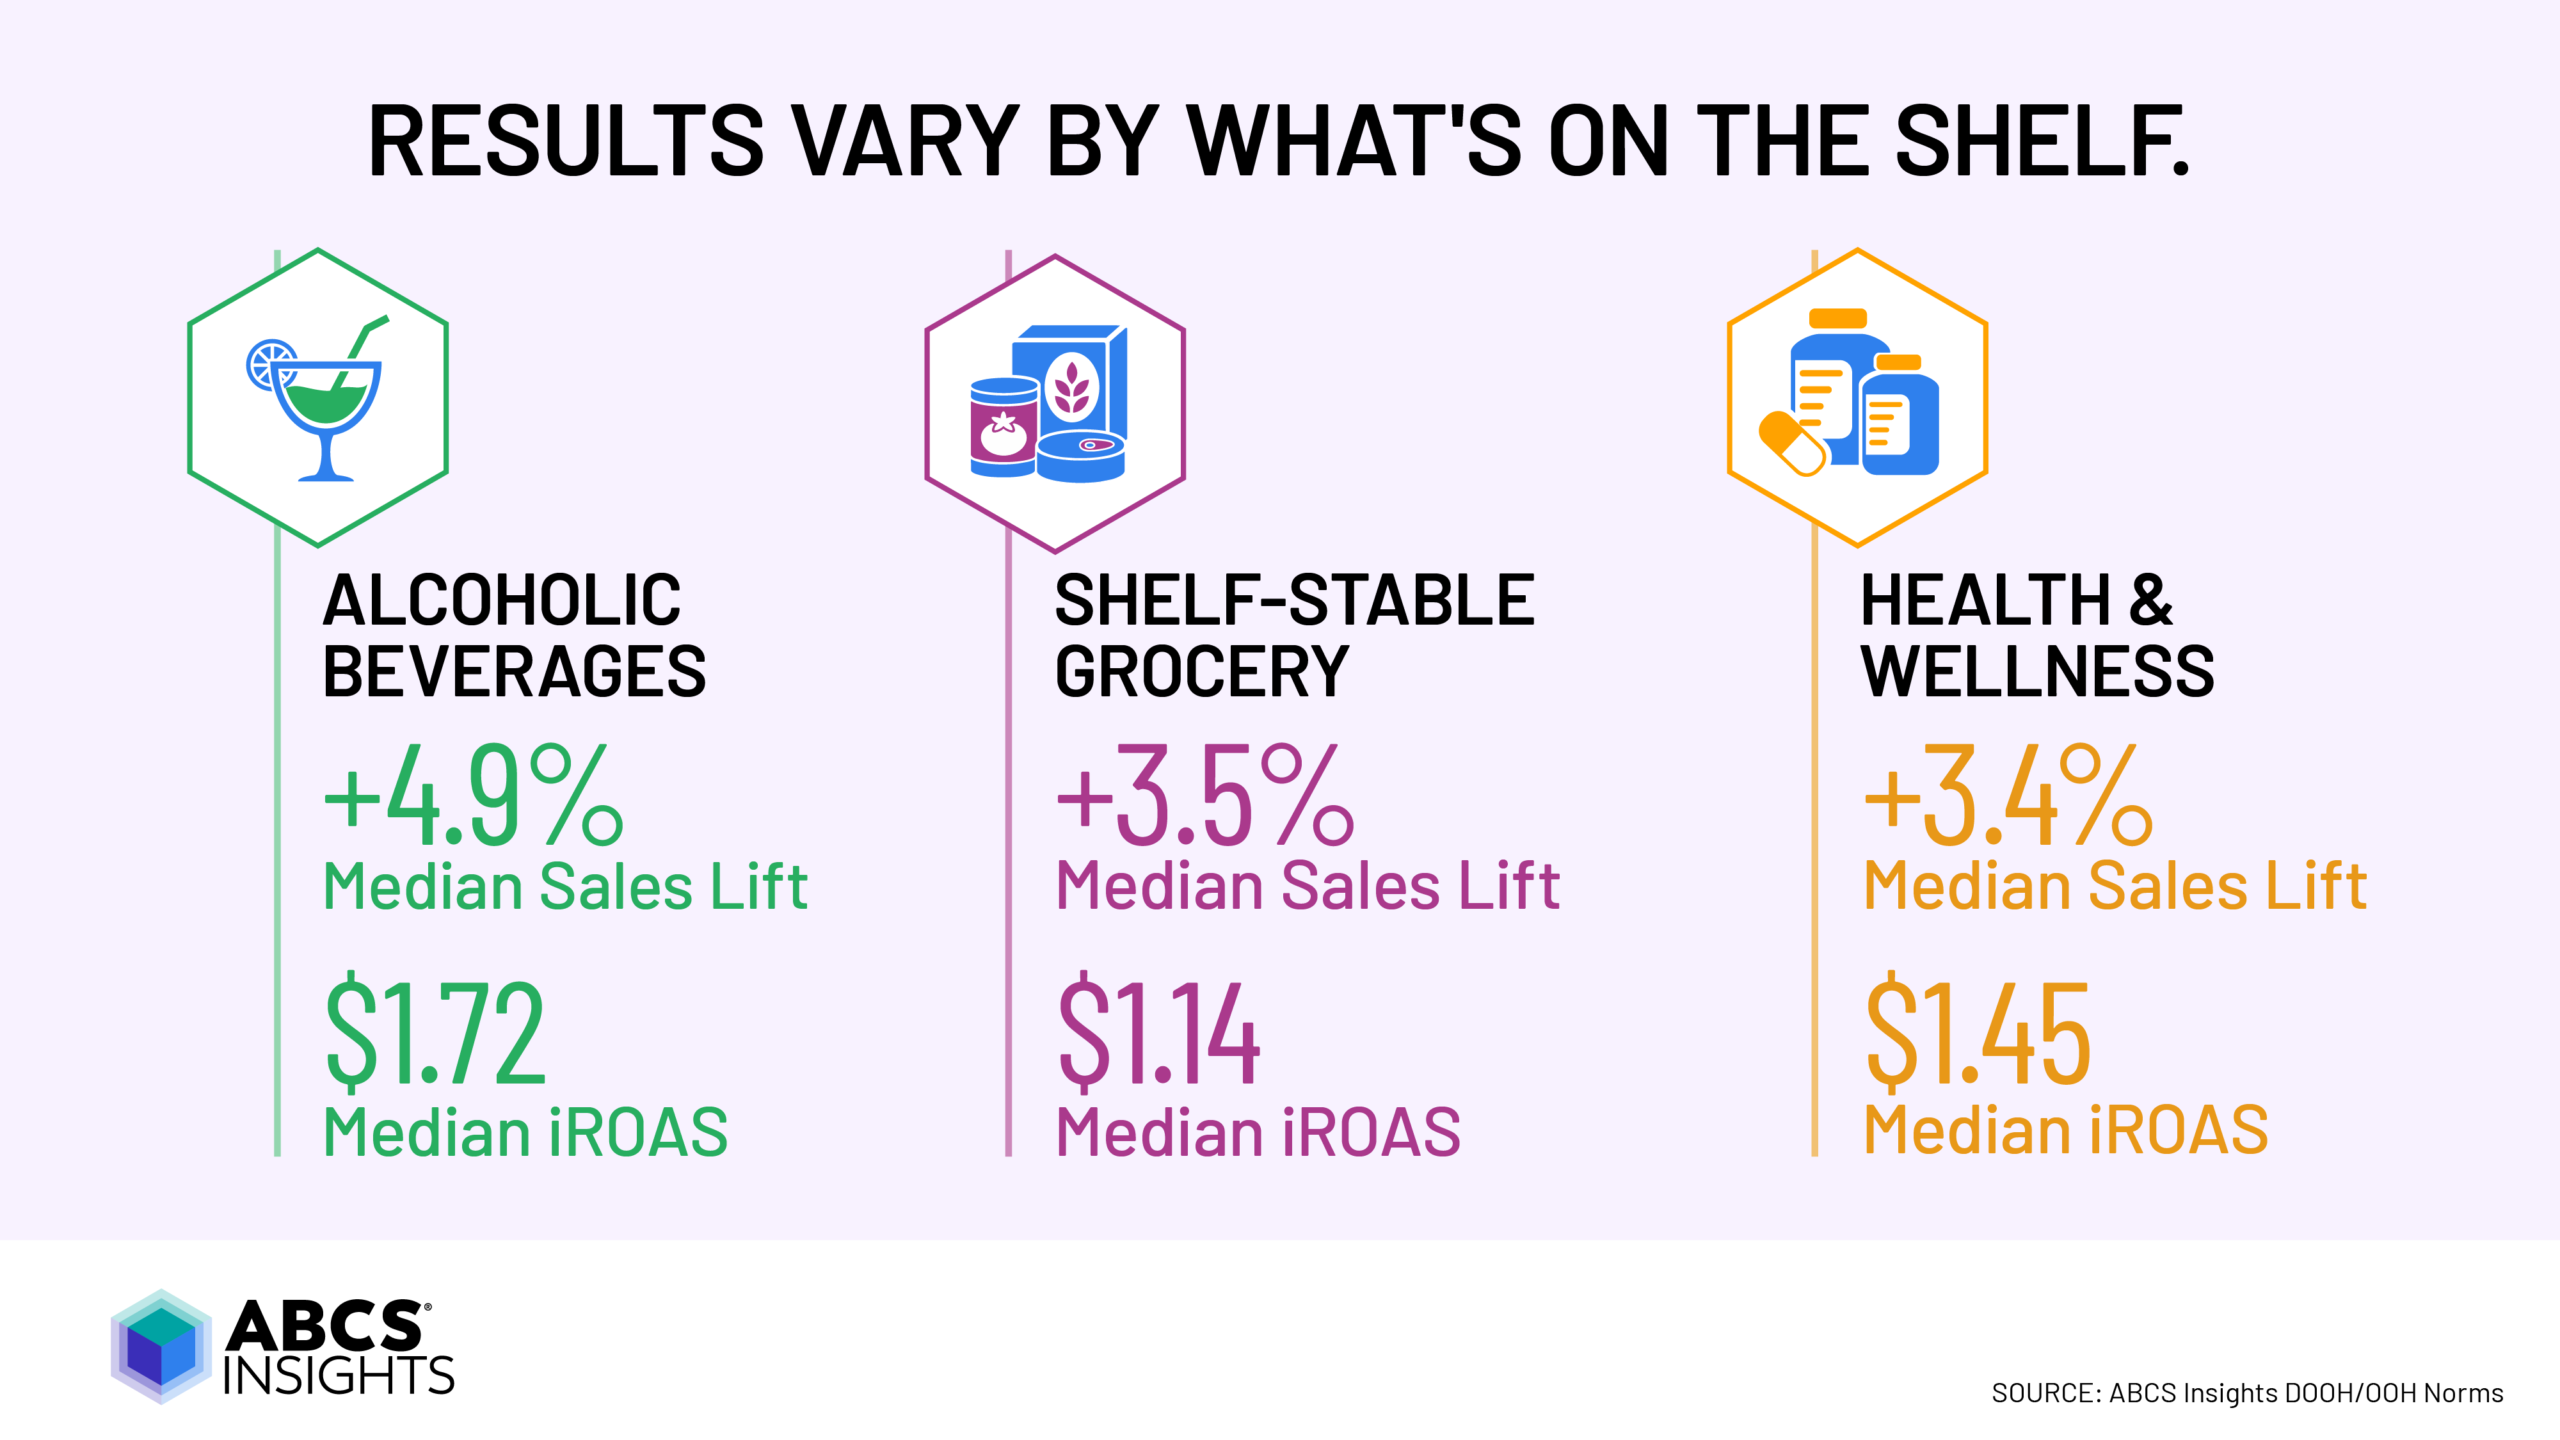
Results vary by what’s on the shelf. Alcoholic beverages led with a +4.9% median sales lift and $1.72 median iROAS. Shelf-stable grocery (+3.5%, $1.14) and health and wellness (+3.4%, $1.45) both posted steady gains, with health and wellness returning more for every dollar spent.
Zoom in further and the spread widens. Liquor posted a +12.1% median sales lift, cosmetics +4.7%, and beer a $2.20 median iROAS. From the bar to the beauty aisle, OOH is driving purchases across categories.
Smaller brands, bigger lifts
OOH isn’t only a big-brand play. Brands with under 1% household penetration saw a +7.9% median sales lift, compared with +1.8% for brands at 10%+ penetration. Campaign size matters less than you might think, too. Our data sets run deep enough to measure hyperlocal activations and small impression loads, even a single billboard. If it ran, it can be connected to purchase behavior.
Standout campaigns
Norms tell you what’s typical. These campaigns show what’s possible when the plan, placement, and audience align. Each grew differently, and we measured each across the full range of outcomes, from sales lift and household penetration to purchase frequency.
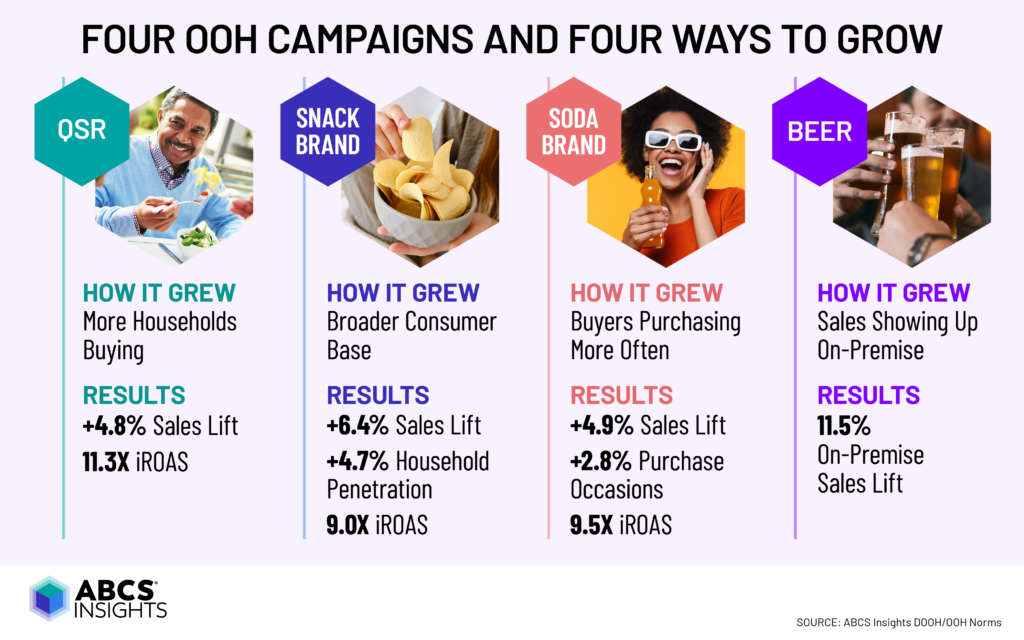
A QSR brand grew by getting more households buying, delivering a +4.8% sales lift and 11.3X iROAS. A snack brand broadened its consumer base, with household penetration up 4.7% on the way to a +6.4% sales lift and 9.0X iROAS. For a soda brand, growth came from existing buyers purchasing more often, with purchase occasions up 2.8%, a +4.9% sales lift and 9.5X iROAS. And for one beer brand, the payoff showed up on-premise, with an 11.5% lift in sales at bars and restaurants.
From screen to outcome
ABCS connects media exposure to real-world outcomes: household-level, cross-media and full-funnel. Our measurement is built on three principles. It’s connected, linking exposure to purchases across channels and the purchase journey. It’s consistent, so results compare across campaigns, categories, and partners. And it’s causal, isolating the incremental lift a campaign actually drove.
We’ve measured campaigns across CPG, auto, beauty, tech and telecom, retail, financial services, travel, QSR and entertainment, working with partners across the DOOH/OOH ecosystem.
Want to learn more about our measurement for DOOH/OOH or other media?